For the last two years, the automotive industry has felt like a WWE wrestling SmackDown event. This current year is turning out to be WORSE than last year. Here are insights into the used car inventory on Dealer Lots:
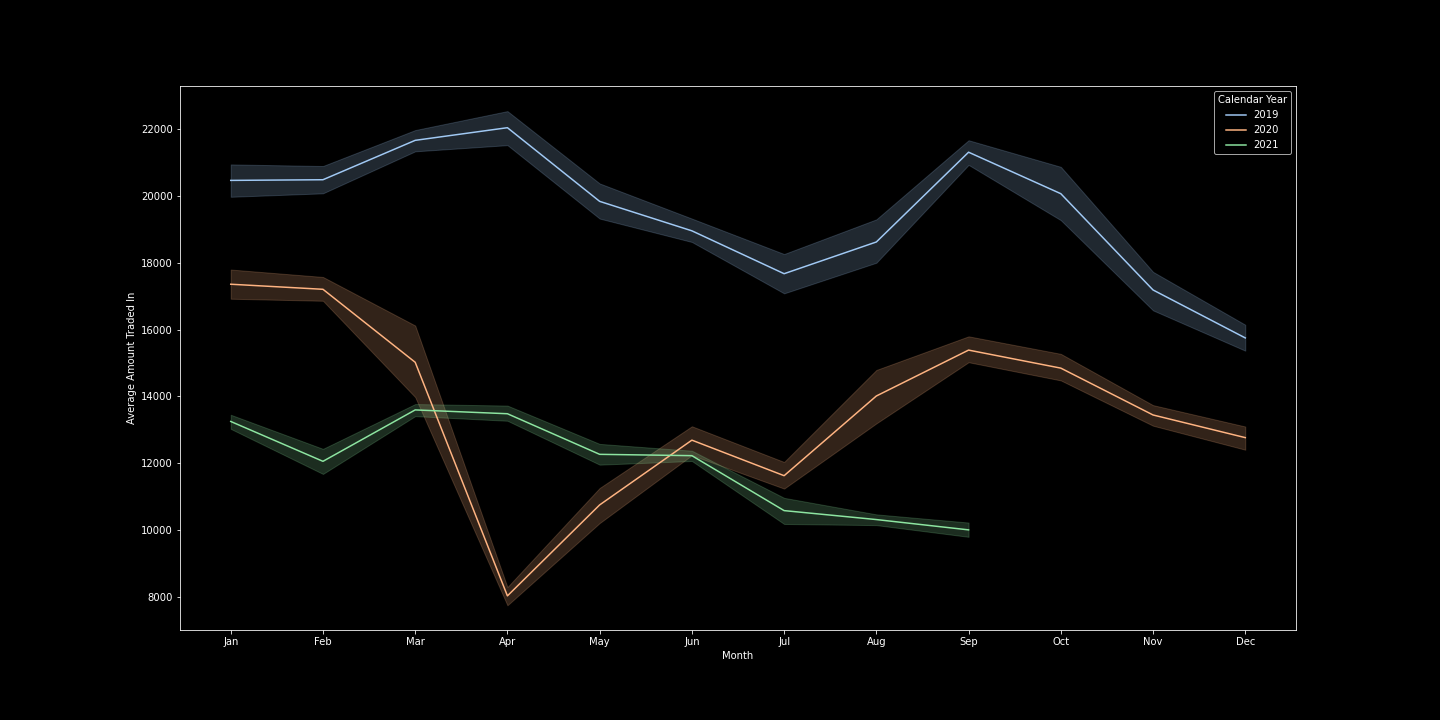
- This graph compares the last 3 years: 2019 (normal), 2020 (COVID), and 2021 (Feb storms and chip shortage)
- These numbers show the used vehicles that were first posted for sale on dealers’ lots across the country. This includes both franchises and independents.
- Typically, these are the vehicles that someone has traded in when purchasing another vehicle.
- The lines are a 7-day rolling average
- The lines show 2019 with fairly normal cycles which include a slow down towards the year’s end.
- The COVID shutdown is evident in April of 2020.
- The normal industry cycles are evident at the end of 2020, although lower overall.
- Finally, we can see the effects of the February storms and now the chip shortage, which has caused a large divergence. Source: Xcelerated Data® I Sold It™ file (compiled daily)